On this page, you'll learn about how debugging via the Wi-Fi Developer Board works. To illustrate this process, we'll start a debug session for Flipper Zero's firmware in VS Code using the native Flipper Build Tool.
The Developer Board acts as the debug probe, which provides a bridge between the IDE (integrated development environment) with a debugger running on a host computer and the target microcontroller (in your Flipper Zero). The user controls the debugging process on the computer connected to the Developer Board via Wi-Fi or USB cable.
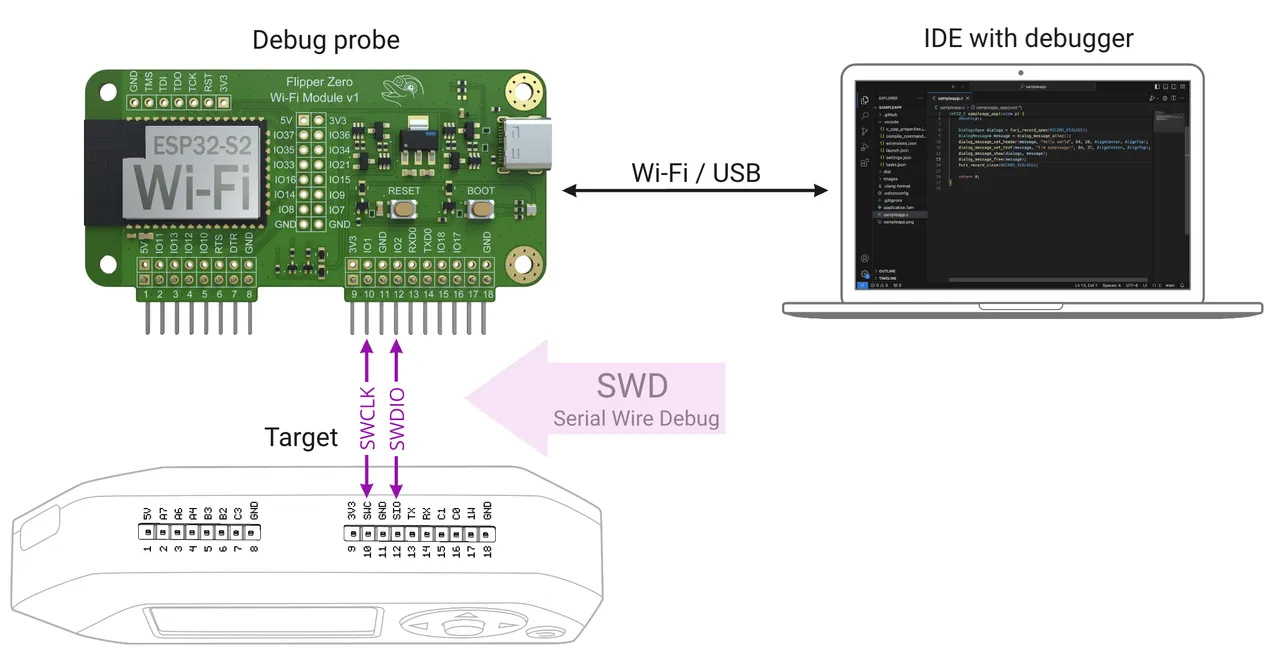
Data exchange between the Wi-Fi Developer Board and your Flipper Zero is conducted via the Serial Wire Debug interface. The following GPIO pins serve this purpose:
To learn more about Flipper Zero pinout, visit GPIO & modules in Flipper Docs.
You'll need Git installed on your computer to clone the firmware repository. If you don't have Git, install it following the official installation guide.
Before starting debugging, you need to clone and build Flipper Zero firmware:
Clone the firmware repository:
Run the Flipper Build Tool (FBT) to build the firmware:
From the flipperzero-firmware directory that you cloned earlier, run the following command:
This will upload the firmware you've just built to your Flipper Zero via the Developer Board. After that, you can start debugging the firmware. We recommend using VS Code with the recommended extensions (as described below), and we have pre-made configurations for it.
To debug in VS Code, do the following:
You should see a notification about recommended extensions. Install them.
If there were no notifications, open the Extensions tab, enter @recommended in the search bar, and install the workspace recommendations.
./fbt vscode_dist command. This will generate the VS Code configuration files needed for debugging.In VS Code, open the Run and Debug tab and select a debugger from the dropdown menu:
Note that when debugging via USB, you need to make sure the selected debugger matches the debug mode on your Devboard. To check the debug mode on your Devboard, access the Devboard's web interface as described here and check the USB mode field. If you want to use a different debug mode, enable this mode by following the steps in Devboard debug modes.
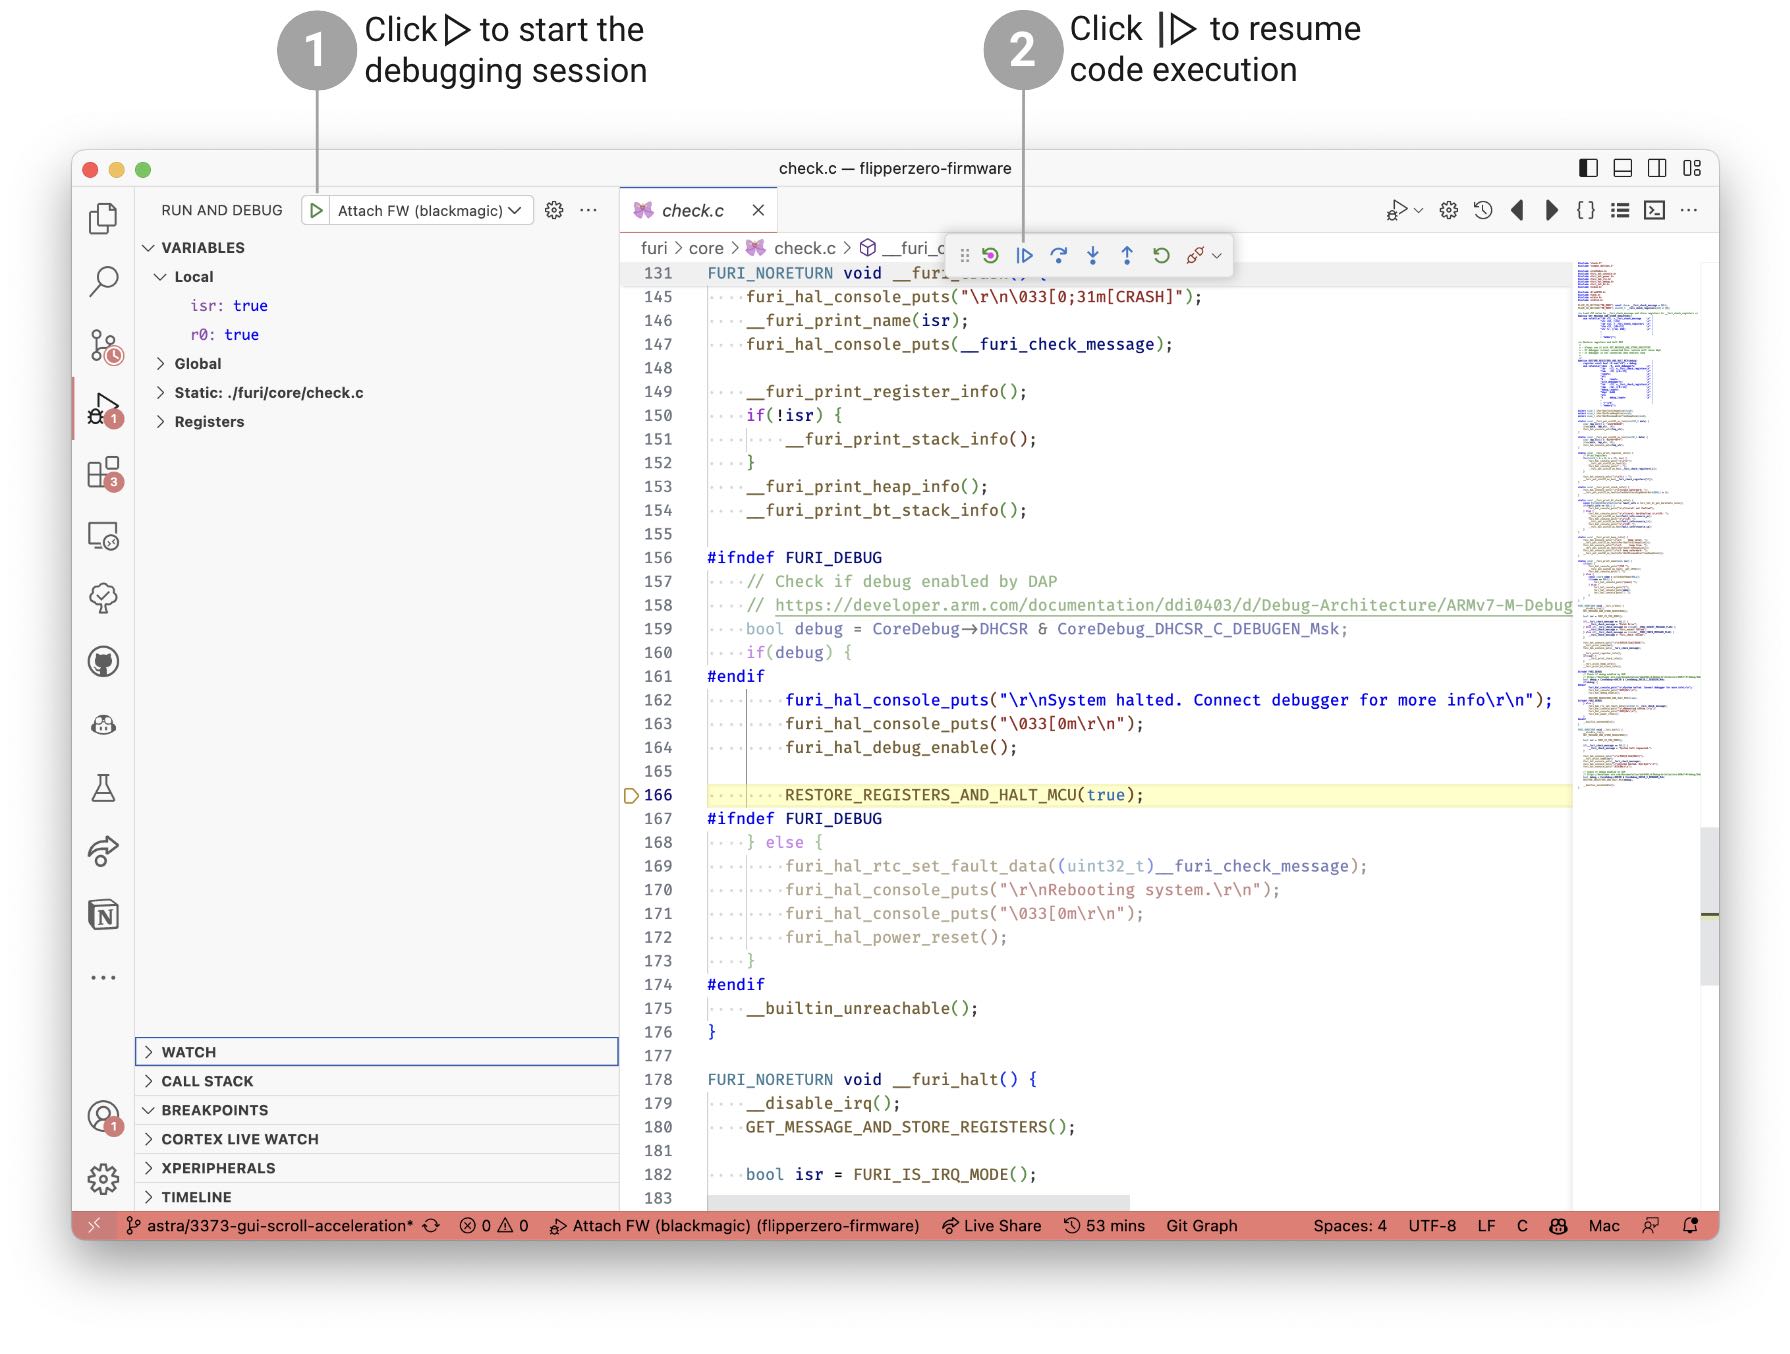
./fbt flash command, then click the ▷ Start Debugging button in the debug sidebar to start the debugging session.