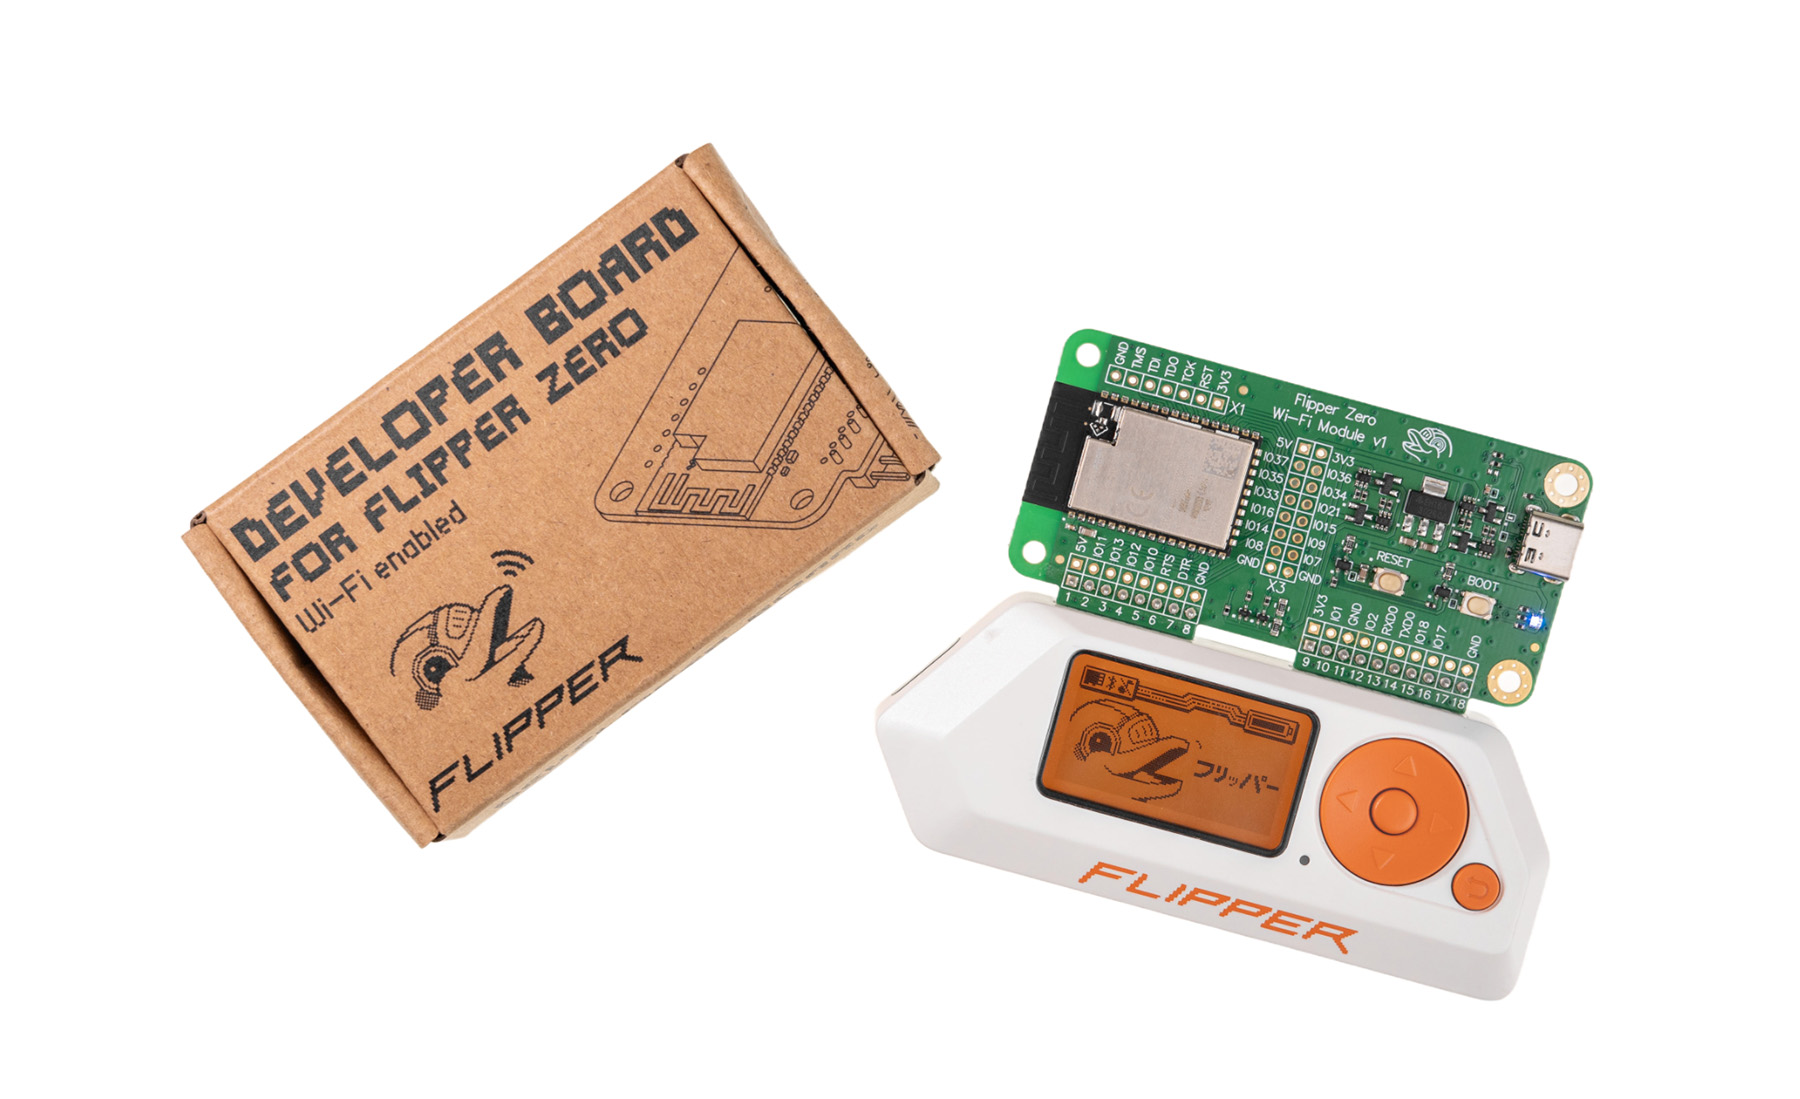
Before you start using your Devboard, you need to prepare your Flipper Zero and Devboard for debugging. In this guide, we'll walk you through all the necessary steps and provide links to explore the Devboard's capabilities further.
Since the main purpose of the Developer board is to debug applications on Flipper Zero, you first need to enable Debug Mode. To do so, go to Settings → System and set Debug to ON.
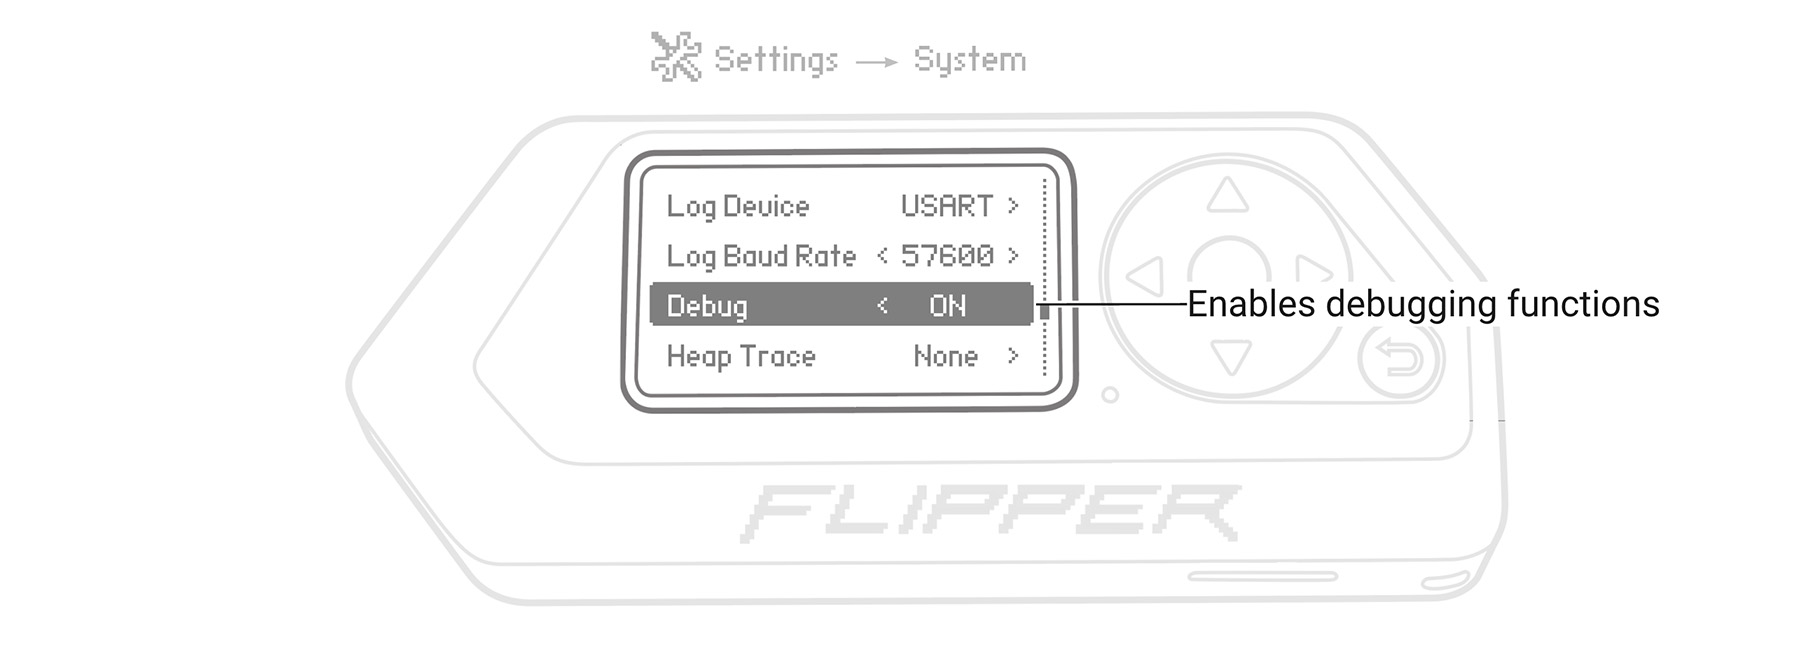
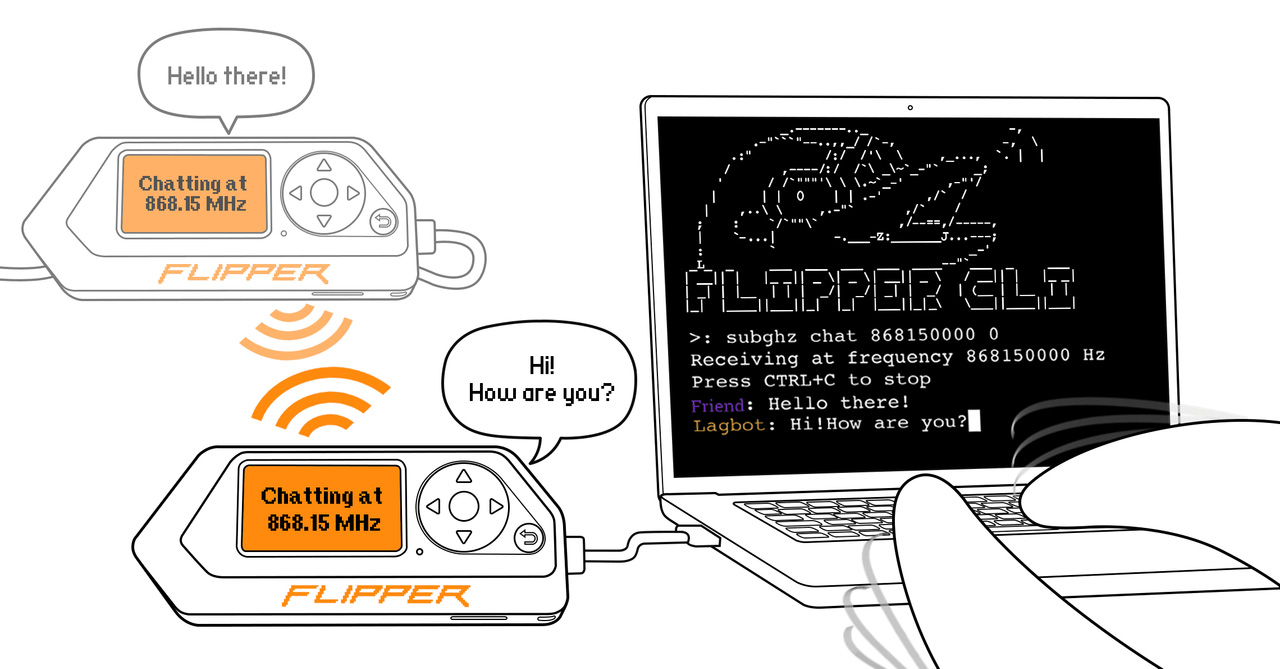
Debug Mode allows you to debug your apps for Flipper Zero, as well as access debugging options in apps via the user interface and CLI. To learn more about Flipper Zero CLI, visit Command-line interface in Flipper Docs.
The Developer Board comes with stock firmware that may not include all the latest features and bug fixes. To ensure optimal performance, please update your board's firmware using the instructions in Firmware update on Devboard.
Once your Developer Board firmware is up to date, you can proceed to plug it into your Flipper Zero. Two important things to keep in mind:
Power off your Flipper Zero before plugging in the Developer Board.
If you skip this step, you may corrupt the data stored on the microSD card. Connecting external modules with a large capacitive load may affect the microSD card's power supply since both the microSD card and external module are powered from the same 3.3 V power source inside Flipper Zero.
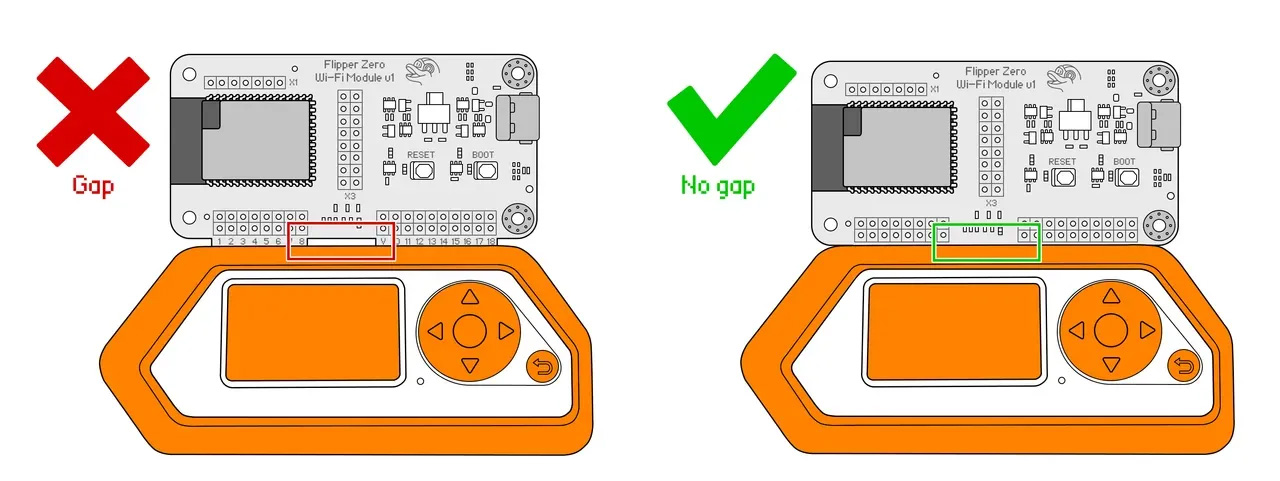
Make sure the Developer Board is inserted all the way in.
If your Flipper Zero isn't in a silicone case, insert the module all the way in so there is no gap between your Flipper Zero and the Devboard. You may need to apply more force to insert it completely. After that, press and hold the BACK button to power on your Flipper Zero.
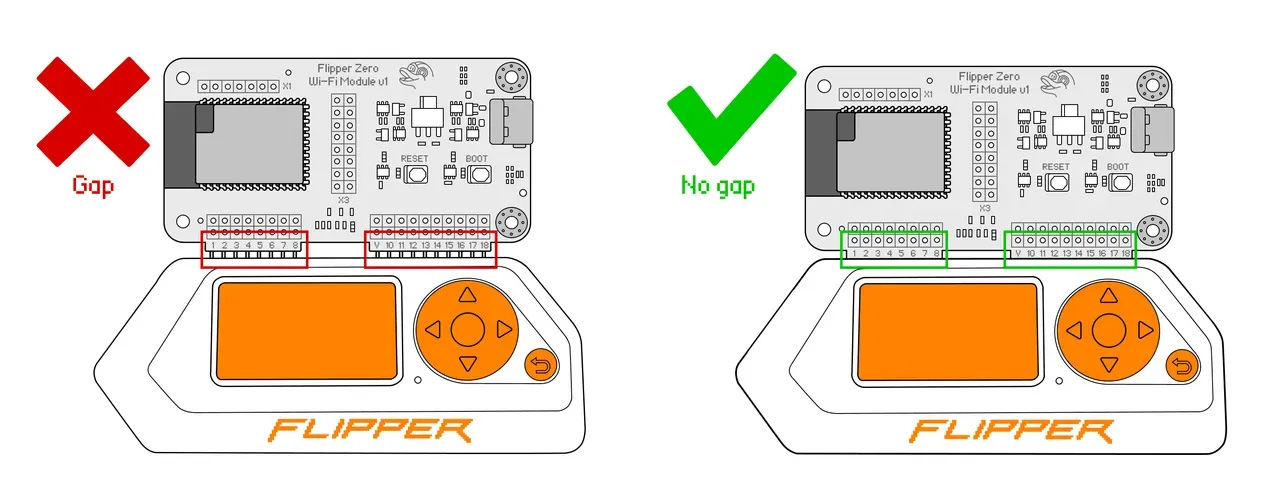
If your Flipper Zero is in a silicone case, insert the module all the way in so there is no gap in the middle between the silicone case and the module. After that, press and hold the BACK button to power on your Flipper Zero.
Now, you can connect the Developer Board to your computer via USB or Wi-Fi, depending on your needs. We described both methods in separate documents:
You are ready to debug now! To further explore what you can do with the Devboard, check out these pages:
These guides should help you get started with your Devboard. If you have any questions or you want to share your experience, don't hesitate to join our community on Reddit and Discord, where we have a dedicated wifi-devboard channel.